
Let’s generate a word cloud like this. Don’t understand the language is not a big deal. If your written language is based on latin alphabet(or other language has space between words), skip tokenization.
Background
Recently, I set up a web-based RSS client for retrieving and organizing everyday news. I used TinyTinyRSS, or as ttrss, a popular RSS client which friendly to docker. Thanks to developer HenryQW, a well-written Nginx-based docker configuration is already available in docker hub. With more feeds were added, I found some feeds does not need to be checked everyday. Thus I was thinking to create a script to automatically list all keywords appears in a last period and generate a heat map kind figure of it.
Before you go further, I’ll tell you all my settings to give readers a general overview.
My first step is to read all text-based information from TTRSS’s PostgreSQL database. With information, I used a Chinese-NLP library, jieba, to extract all keyword with their occurrences frequency. By using WordCloud, a python library, word cloud figure is generated and present. More details will be discussed in later sections.
Get RSS feeds’ text
My first thought is generating a keyword heat map for economy news of a last week. Since this blog post are more skewed to Chinese tokenization and draw the word cloud figure. I’ll leave my code here just in case. The SQL connector I used is psycopg2, an easy-use PostgreSQL library.
def __init__(self):
	self.dbe = psycopg2.connect(
    	host=DB_HOST, port=DB_PORT, database=DB_NAME, user=DB_USER, password=DB_PASS)

def get_1w_of_feed_byid(self, id=1) -> list:
	cur = self.dbe.cursor()
    cur.execute('SELECT content FROM public.ttrss_entries \
    	where date_updated > now() - interval \'1 week\' AND id in ( \
        select int_id from DB_TABLE_NAME \
        where feed_id=' + str(id) + ' \
        ) \
        ORDER BY id ASC '
        )
	rows = cur.fetchall()
	return rows
Most arguments are intuitive and easy to understand. The only exception is argument of function get_1w_of_feed_byid. This id is the feed index of my subscriptions.
Tokenize with frequency
Two popular tokenization library were used, and I chose jieba after a few comparison. Before cutting the sentence, we first need to remove all punctuation marks.
def remove_biaodian(text: str) -> str:
    punct = set(u''':!),.:;?]}¢'"、。〉》」』】〕〗〞︰︱︳﹐、﹒
                ﹔﹕﹖﹗﹚﹜﹞!),.:;?|}︴︶︸︺︼︾﹀﹂﹄﹏、~¢
                々‖•·ˇˉ―--′’”([{£¥'"‵〈《「『【〔〖([{£¥〝︵︷︹︻
                ︽︿﹁﹃﹙﹛﹝({“‘-—_…''')
    ret = ""
    for x in text:
        if x in punct:
            ret += ''
        else:
            ret += x
    return ret
After we have an all characters string, we can call jieba. By using the function jieba.posseg.cut with or without paddle, we can have a word list and their “part of speech”. As you can see in the following code, I also did two more works.
First, in the if statement, I only kept all nouns with some categories. Category abbreviation such as “nr” and “ns” represent different “part of speech”, I attached with categories I used in the following table. For more details you can find in this link.
The second work is only keeping words with length longer than 2 characters. In Chinese, there’s no space between words such as Latin writing systems. Since then, some single-character-words such as conjunction words are easy to be misrecognized as specialty-noun. And this misrecognition will cause more single-character being regarded as specialty-noun. I am not able to improve NLP method, so I used a easy way to fix this by removing any words less than 2 characters.
import jieba.posseg as pseg

def get_noun_jieba(self, content: str) -> list:
	content = remove_biaodian(content)
	words = pseg.cut(content)	# Invoking jieba.posseg.cut function

	ret = []
	for word, flag in words:
		# print(word, flag)
		if flag in ['nr', 'ns', 'nt', 'nw', 'nz', 'PER', 'ORG', 'x']:   # LOC
			ret.append(word)
	return [remove_biaodian(i) for i in ret if i.strip() != "" and len(remove_biaodian(i.strip())) >= 2]
- Word category names and abbreviations
| Abbreviation | Category name/ Part of speech |
|---|---|
| nr | People name noun |
| ns | Location name noun |
| nt | Organization name noun |
| nw | Arts work noun |
| nz | Other noun |
| PER | People name noun |
| ORG | Location name noun |
| x | Non-morpheme word |
With all words extracted, we can easily calculate their frequencies. After this, we can using the following line of code to print a sorted result to verify correctness.
noun = seg.get_noun_jieba(test_content)
# ... Calculate frequency of above word list ...
print(sorted(a_dict.items(), key=lambda x: x[1]))
Draw word cloud
With a keyword and frequency dictionary(data structure), we can just call built-in functions from wordcloud library to generate the figure.
First we need to initialize an instance of wordcloud class. As you can see in my code, I set it with 6 parameters. Width and Height of the canvas, maximum amount of words used to generate the figure, the font of words, background color and margin between any two words.
After having the instance, we call function generate_from_frequencies and pass keyword dictionary to it. The return value of this function is an bitmap image, which we can use matplotlib to plot it to your screen.
I tested my plot on ubuntu-subsystem on Windows 10, unfortunately matplotlib under subsystem depends on x11 window manager and its not default available on windows. We need to install an x11 manager to support. Xming is the one I used.
from wordcloud import WordCloud
import matplotlib.pyplot as plt

font_path = "./font/haipai.ttf"
output_path = "./font/out.png"


def show_figure_with_frequency(keywords: dict):
    wc = WordCloud(width=828, height=1792, max_words=200, font_path=font_path,
                   background_color="white", margin=1).generate_from_frequencies(keywords)
    plt.imshow(wc)
    plt.axis('off')
    plt.show()
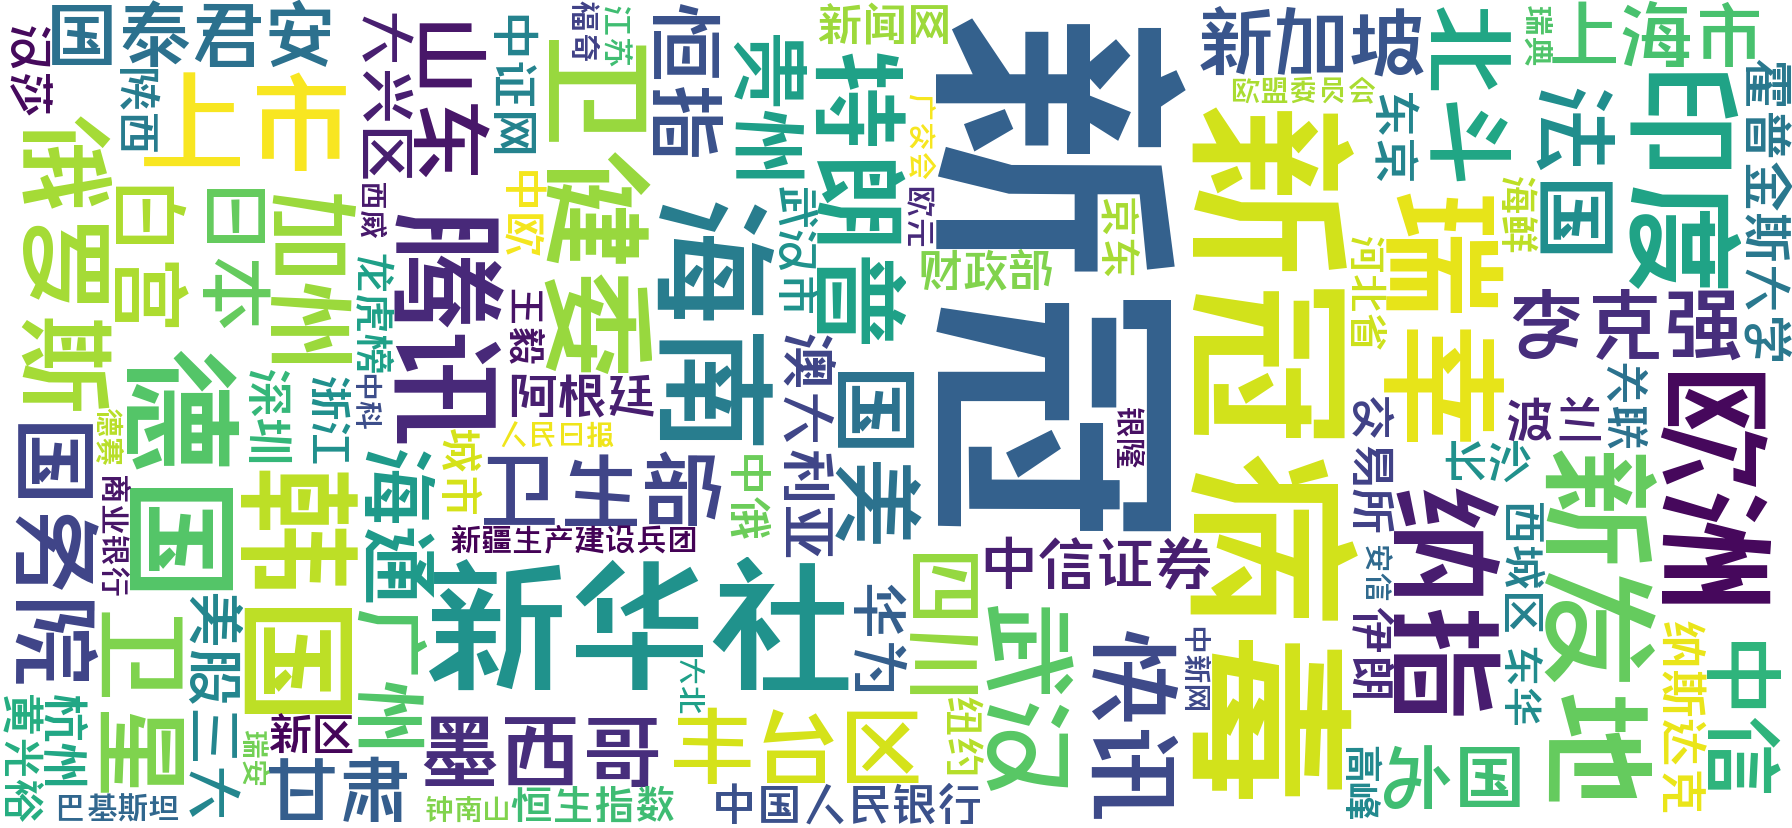
If everything work fine, a word cloud figure will show up in a new window. My version looks like this.
This generated word cloud figure reflects the most popular economy news’ keyword in the week started 06-28-2020. Two largest words in the figure are “新冠” and “新冠病毒”, both means “Covid-19” (This figure was in the week of the second covid spur in Beijing, China). The size of the image fits my phone screen and I can use an app to automatic sync it to my phone’s wallpaper. However, in this image, too many location nouns are presented. This will be something I can make progress on in the future.